Find what your trades really cost.
TradJour rebuilds your profit and loss from the fills your broker exports, shows every trading day on a calendar, and puts a price on each habit that loses you money.
Sample data: 12 trades, profit factor 3.22.
Recorded in the app with the sample trades from this page: the overview, a month of days, and one trade with its fills.
Every number traces back to a fill.
Scale in twice, scale out twice: it stays one trade, priced at your average entry. Net profit is never typed in or stored. It is recomputed from the executions, so an import and a hand check always agree.
| Time (UTC) | Side | Qty | Price | Fee |
|---|---|---|---|---|
| Oct 6, 13:35 | buy | 50 | 118.40 | 1.00 |
| Oct 6, 13:48 | buy | 50 | 117.90 | 1.00 |
| Oct 6, 14:20 | sell | 60 | 121.20 | 1.00 |
| Oct 6, 15:05 | sell | 40 | 120.60 | 1.00 |
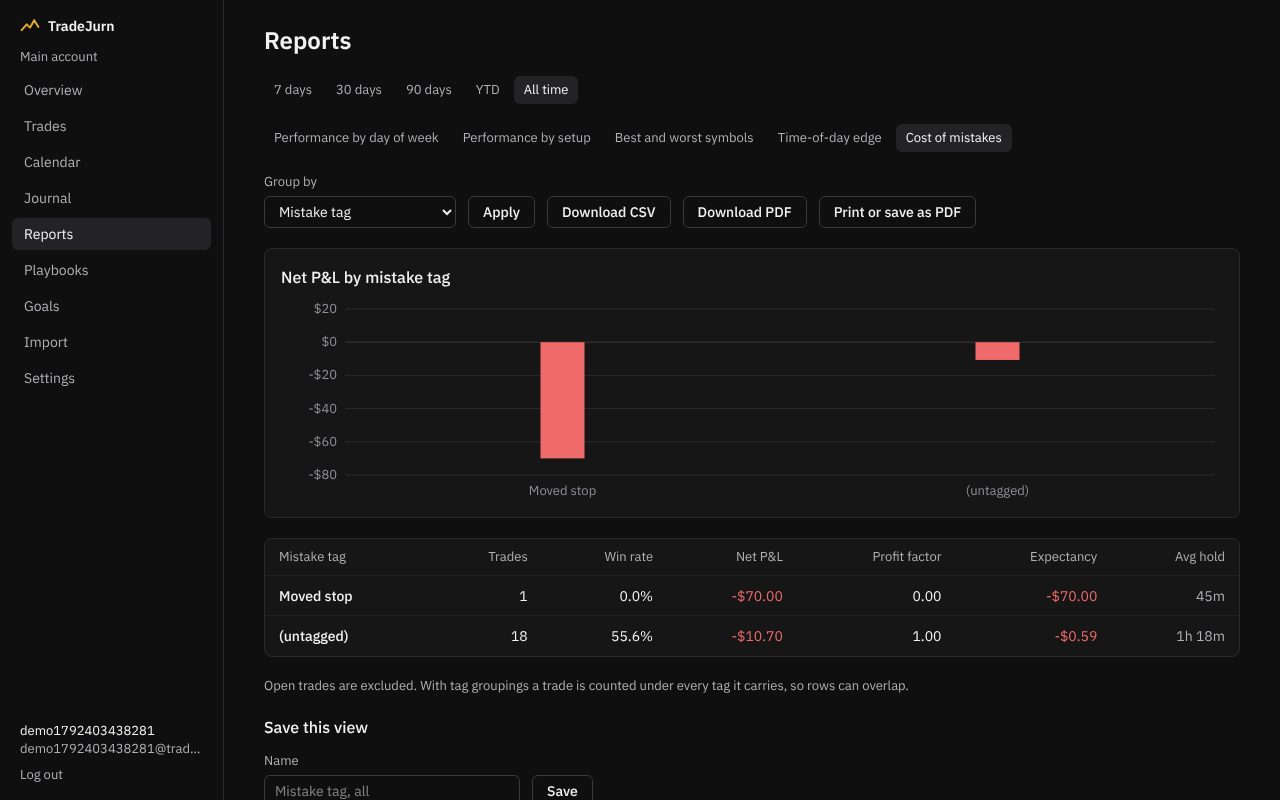
Tag the mistake once. See what it cost you.
Tag a trade “moved the stop” and the report adds up every loss that carries the tag, so a habit becomes a dollar figure you can argue with.
| Habit (sample) | Trades | Average loss | Total cost |
|---|---|---|---|
| Moved the stop | 7 | -$1,050.25 | |
| Entered before the setup | 4 | -$343.60 | |
| Sized up after a loss | 2 | -$565.60 |
Sample data. Drawdown is measured from the peak, so the dip after it is the number that matters.
Bring your history, twice if you like.
Upload a CSV, check the column mapping, import. The mapping is remembered for next time, and a fill already stored is skipped, so overlapping exports never double-count.
Start journalingBuilt-in column layouts
- Generic (Date,Symbol,Side,Qty,Price,Fees)
- Tradovate fills
- Webull orders
- Interactive Brokers (Flex trades)
- thinkorswim account statement
- Any other CSV, mapped by hand
These are file layouts, not live broker connections.